
While Eion is in the business of removing carbon, even carbon removal solutions like ours generate emissions. To properly determine how much CO2 a process like enhanced rock weathering removes, we use a life cycle assessment, a standardized practice businesses of all types use to understand their overall carbon impact.
To calculate the precise net effect of our process, we track the emissions generated in our operations and subtract them from the carbon removed by enhanced rock weathering (ERW). A few key things we learned in this process:
- There are often multiple ways to calculate carbon emissions at each step, and we will keep improving to get to the most accurate and scalable methods.
- Most of our carbon emissions come from transportation. We’ll become more efficient as we scale, and emissions will decrease as transportation systems decarbonize by deploying zero-emission fuels and vehicles.
- Enhanced rock weathering relies on nature to do the heavy lifting of removing and sequestering carbon. That means our process can be impactful and remove carbon today without a massive buildout of the renewable energy grid.
The Steps of the ERW Process
We use a variety of data sources at each stage of our process to understand emissions and removals.
| How We Measure | We quantify emissions using standardized life cycle analysis methodologies, like ISO 14044. | We quantify carbon removal using Eion’s patented direct measurement process. | We rely on models from federal agencies that have been used for decades in monitoring systems. |
| Project Steps |
|
6. Weathering (Carbon Removal) | 7. System Loss (Re-emission) |
Tracking Emissions from Quarry to Field and Beyond

Step 1: Quarry (Extraction)
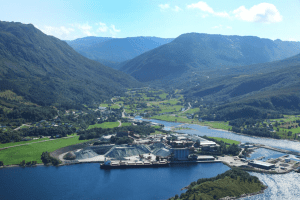
Currently, 80% of the global olivine production originates from Åheim, Norway, where quarrying businesses like our partner Sibelco have safely handled the mineral for generations. Sibelco uses hydropower to quarry olivine, and the quarry’s close proximity to the processing facility and shipping terminal enables them to run a large-scale, highly efficient operation with a low CO2 footprint.
Data sources:
- The carbon emissions from the rock extraction process at the quarry can be calculated either using published emissions factors and electricity and fuel records, or estimating based on publicly available tools and models.
- However, by partnering with Sibelco we have access to the actual supply chain carbon accounting of the quarry, which gives us the most accurate quantification of carbon emissions for this step.
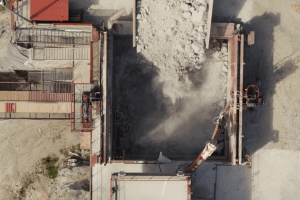
Step 2: Processing (Pulverizing)
Sibelco pulverizes the olivine to the ideal particle size for us to maximize both agronomic benefits for farmers and carbon sequestering potential.
Data sources:
- Sibelco provides access to their supply chain carbon accounting.
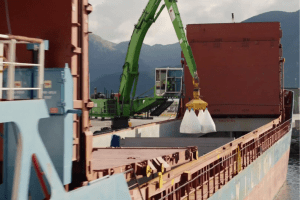
Step 3: Ocean Transport (Shipping)
We move olivine from Norway to New Orleans, LA via ocean transport. It may sound crazy to ship rock all the way from Norway to the US, but large bulk ocean transportation has a lower carbon footprint per ton of rock transported than, for example, moving it by rail across the US.
Data sources:
- We document the route of the ocean vessel by real-time tracking via public satellite positioning data and collect proof from the Port of New Orleans that the ship was received and offloaded.
- We receive fuel consumption records of the vessel showing the amount of fuel on board upon departure and arrival. To calculate carbon emissions for ocean transport, we use fuel emissions factors published by the U.S. Environmental Protection Agency (EPA) or the Department for Environment, Food, and Rural Affairs (DEFRA) of the UK government.
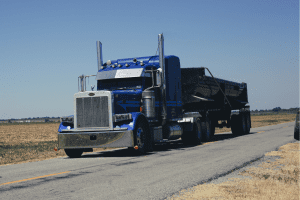
Step 4: Deployment Transportation (Distribution)
Olivine is transported from the Port of New Orleans to farms in Mississippi using articulated trucks (aka rock trucks). We use two pieces of information to calculate emissions: how far each truck travels and how much rock is on board. For each truck transportation leg, a waybill gets issued with the exact amount of rock transported.
During our first deployment, we determined distance by using Google Maps. We mapped the start and end destination and exported the GPS coordinates. In pursuit of the most efficient routes and precise emissions data, we are excited to work with our agricultural partner, who installs GPS trackers on each truck to provide real-time route data for our current deployments. This helps to ensure the most accurate carbon accounting for truck distribution to farms.
Data sources:
- We collect bills of lading and waybills for each truckload of material, which include the names of the consignor and consignee, point of origin, and destination.
- GPS trackers record the distance of each truck deployment leg.
- We multiply the measure of cargo transport by emissions factors for articulated trucks published by the EPA or DEFRA.
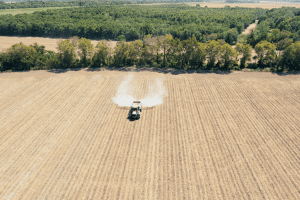
Step 5: Application (Spreading)
Farmers spread olivine on their fields using standard farming equipment during the course of regular farm management. Where available, we use GPS technology to map the applications.
Data sources:
- We multiply the farm equipment’s fuel consumption by emission factors published by the EPA or DEFRA.
- Where no fuel consumption record of the farm equipment is available, we use fuel consumption data from an officially designated Organization for Economic Cooperation and Development (OECD) tractor test laboratory.
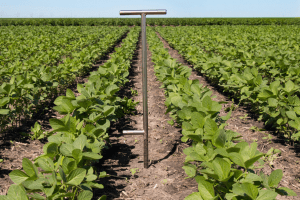
Step 6: Weathering (Carbon Removal)
Rain and soil acidity help the olivine suck up CO2. We quantify carbon dioxide removal by measuring soil samples before and after applying the mineral and comparing the two results to understand how much CO2 was removed in the process. Read more about how our patented process works here.
Since enhanced rock weathering is in the early stages, we’re prioritizing getting direct measurements and gathering as much real-world data as we can to understand how things work in a variety of conditions.
Data sources:
- We measure CO2 removal using immobile trace elements as geo-tracers in soil from pre- and post-rock application samples.
- Soil and rock samples are sent three independent commercial third-party soil analysis laboratories for testing.
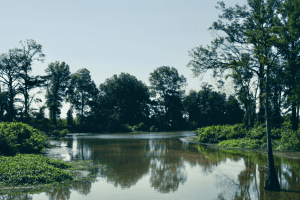
Step 7: System Loss
While the vast majority of the carbon dioxide absorbed during weathering ends up stored in the ocean, some of it escapes along the way. When the captured CO2 meets alkaline and saline marine environments near the oceans, a small amount of CO2 is immediately re-emitted.
This means that the net impact of ERW depends on the capacity of rivers and the ocean to transport and store the captured carbon. We take this into account in the LCA by estimating these inevitable system losses using geochemical models and subtracting them from the carbon dioxide removed.
Data sources:
- We use site- and path-specific aqueous chemistry data to calculate riverine system effects, and ocean chemistry reanalysis data to compute global oceanic dissolved inorganic carbon retention.
Checking the Math
Eion’s full life cycle assessment of emissions and reductions tracking is in the process of being audited by DNV, an independent third party. That process should be completed later this year and we intend to share as much as we can so the public can better understand how enhanced rock weathering works through the entire project lifecycle.
In the meantime, we hope this look behind the scenes helps shed light on what we’re doing out there in the field. For more insight into some of our active research on how variable conditions can impact weathering rates, check out this interview with Alison Marklein and Kelly Anne Tucker.